
=GRIDXYZ(xy, z, grid_x, grid_y, [options])
GRIDXYZ is a powerful 3D data gridding function based on natural neighbor interpolation algorithm. It can be used to map a set of
scattered data points onto a uniform rectilinear grid for the purpose of plotting a 3D surface in Excel.
Use GRIDXYZ to map set of scattered (x,y,z) data points onto a uniform rectilinear grid
GRIDXYZ automatically sorts your data set and averages the z values if your data set contains duplicate (x,y) points.
xy a 2-column array of scattered (x,y) points coordinates.
z a vector of corresponding z values
grid-x a row-vector containing the uniform x-coordinates for the rectilinear grid.
grid-y a column-vector containing the uniform y-coordinates for the rectilinear grid.
The x- and y-coordinates vectors must be arranged as shown.
The yellow range will hold the interpolated grid z values for each (xi,yi) grid point.
You must run GRIDXYZ as an array formula in the yellow range.
| A | B | C | D | .. | |
| 1 | x0 | x1 | → | xe | |
| 2 | y0 | ||||
| 3 | y1 | ||||
| 4 | ↓ | ||||
| .. | ye |
ctrl a set of key/value pairs for algorithmic control as detailed below.
Description of key/value pairs for algorithmic control
| Key | PERTURB |
| Admissible Values (Boolean) | True or False |
| Default Value | True |
| Remarks | A True value will slightly perturb the locations of the scattered (x,y) points to aid stability of Voronoi construction. This perturbation has no significant effect on the accuracy of the interpolated data. |
| Key | NONNEGZ |
| Admissible Values (Boolean) | True or False |
| Default Value | False |
| Remarks | Set to True to force negative interpolated z values to zero.This may be useful to mask roundoff errors during interpolation when the surface passing through the points is known to be nonnegative. |
Suppose you have a random set of (x,y,z) data points for some function z=f(x,y). How would you plot the 3D surface in Excel? the short answer is you can't
unless you can resample the function at a uniform grid. If the function f(x,y) is unknown, re-sampling at a grid may not be an option.
In this example, we will show how you can use GRIDXYZ to interpolate the scattered data set onto a uniform grid for easy plotting.
To illustrate the concepts, we will sample the random set from a famous function: the Mexican hat function, a radially symmetric
sinc function given by:
which has a shape like a Mexican hat.
To generate the scattered data, we use Excel Rand() function to generate random values for x, and y in the interval [0 12]. To preserve the generated random numbers from continuously changing, we must copy them into a new range as numbers only. The table below shows our generated scattered (x,y) points and corresponding z values for the Mexican hat function using Excel's AutoFill feature.
| A | B | C | |
| 3 | random x | random y | z values |
| 4 | 0.397134783 | 7.460698663 | =SIN(SQRT($A4^2+$B4^2))/SQRT($A4^2+$B4^2) |
| 5 | 0.035390576 | 1.56126043 | 0.64031692 |
| 6 | 5.666441533 | 3.121434807 | ↓ Drag down to row 300 |
| .. | .. | .. | |
| 299 | 8.139633293 | 4.607412473 | 0.007648947 |
| 300 | 1.537710128 | 7.484370584 | 0.127912611 |
We have generated about three hundred points to obtain good coverage for the large [0 12] by [0 12] grid area we plan to use to be able to
to show the Mexican hat function.
The steps to generate a grid in Excel are straight forward. we create a uniform row vector for the x-values and a uniform vertical vector for the y-values,
as shown below. We chose to create a grid in increment of 0.4 from 0 to 12 for both x and y directions using AutoFill. Note how the x- and y-coordinates are arranged.
the yellow shaded area represents the grid (x,y) points at which the z values will be found.
| H | I | J | k | AL | AM | |
| 3 | 0 | 0.4 | → | 11.6 | 12 | |
| 4 | 0 | |||||
| 5 | 0.4 | |||||
| 6 | ↓ | |||||
| 32 | 11.6 | |||||
| 33 | 12 |
Now to interpolate the scattered (x,y,z) data onto the grid, we evaluate the array formula =GRIDXYZ(A3:B300, C3:C300, I3:AM3, H4:H33)
in the yellow range. The first argument A3:B300 is the (x,y) values of the scattered data points, the 2nd argument C3:C300 is the corresponding z values,
the 3rd argument I3:AM3 is the generated grid x values, and the 4th argument H4:H33 is the generated grid y values.
Excel does the rest for us and correctly computes the interpolated z values at each grid location.
The interpolated values are partially shown below.
| H | I | J | k | AL | AM | |
| 3 | 0 | 0.4 | → | 11.6 | 12 | |
| 4 | 0 | 0.933764259 | 0.925546131 | -0.077545355 | -0.072129791 | |
| 5 | 0.4 | 0.886357439 | 0.899864902 | -0.077414724 | -0.075278597 | |
| 6 | ↓ | |||||
| 32 | 11.6 | -0.078428067 | -0.075255129 | -0.038773976 | -0.046496635 | |
| 33 | 12 | -0.076052838 | -0.076907303 | -0.042992068 | -0.04770666 |
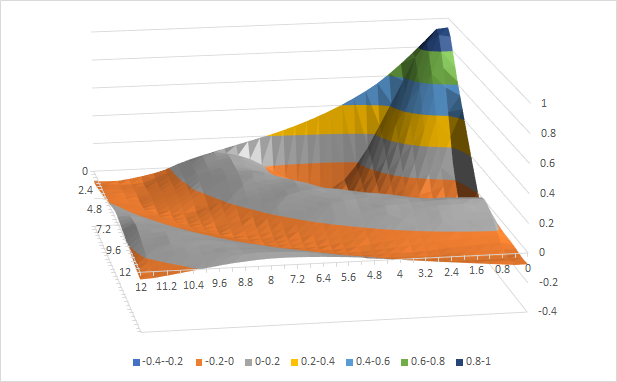
To generate the surface plot in Excel, we simply highlight the yellow range and insert a surface plot. The plot is shown below and shows only one quarter of the radially symmetric Mexican hat function.
GRIDXYZ implements the natural neighbor interpolation algorithm.