
=INTERPXY(x, y, q, [options])
INTERPXY is a versatile 2D interpolation function based on splines.
Use INTERPXY to interpolate from a set of (x,y) data points at an arbitrary point.
Use INTERPXY to map a scattered (x,y) data points onto a uniform grid for easy plotting in Excel.
With optional arguments, you can control the interpolating spline properties.
INTERPXY automatically sorts your data points and averages the y values if your data set contains duplicate x points.
x x-coordinates of the scattered (x,y) points.
y corresponding y values.
q query point to interpolate at.
If q is a vector of points, run INTERPXY
as an array formula.
ctrl a set of key/value pairs for algorithmic control as detailed below.
Description of key/value pairs for algorithmic control
| Key | ORDER |
| Admissible Values (Integer) | 1 or 3 (linear or cubic) |
| Default Value | 3 |
| Keys | ISLOPE, ESLOPE |
| Admissible Values | real number |
| Default Value | Unconstrained |
| Remarks |
|
| Key | PERIODIC |
| Admissible Values (Boolean) | True or False |
| Default Value | False |
| Remarks |
|
| Key | SFACTOR |
| Admissible Values (real) | ≥ 0 |
| Default Value | 0 |
| Remarks |
|
w strictly-positive corresponding set of weights for the (x,y) data points. Default value is unity.
In this example, we sample the function at random points, and then reconstruct the function at a uniform grid for easy plotting in Excel.
Using Excel's RAND() function we generate a vector of random numbers in the range [0 to 3].
To preserve the generated random numbers from continuously changing, we copy them into range A4:A28 as numbers only.
Using AutoFill, we generate corresponding y values in range B4:B28 using the formula =A4*SIN(A4^2)+1.
Next we generate a uniform grid for x values in range D4:D28 from 0 to 3 in increment of 0.125.
Finally, we evaluate =INTERPXY(A4:A28, B4:B28, D4:D28) as array formula in range E4:E28
to interpolate the scattered data onto the uniform grid. The numerical values are shown below.
| A | B | D | E | |
| 3 | scattered x | y values | unifrom x | interpolated y |
| 4 | 1.753029064 | 1.119956695 | 0 | 1.001328093 |
| 5 | 0.568116228 | 1.180195958 | 0.125 | 1.002172559 |
| 6 | 1.440216258 | 2.26153531 | 0.25 | 1.01561687 |
| 7 | 2.28511224 | -0.995044984 | 0.375 | 1.052557644 |
| 8 | 1.015003489 | 1.870282715 | 0.5 | 1.123729162 |
| 9 | 1.217131211 | 2.212271884 | 0.625 | 1.238002939 |
| 10 | 2.429384636 | 0.096014392 | 0.75 | 1.400044332 |
| 11 | 1.061113672 | 1.95784828 | 0.875 | 1.606510771 |
| 12 | 2.828238912 | 3.79857802 | 1 | 1.84148167 |
| 13 | 1.590985661 | 1.911889769 | 1.125 | 2.073236147 |
| 14 | 1.454578337 | 2.243848266 | 1.25 | 2.249813639 |
| 15 | 1.639359184 | 1.719102308 | 1.375 | 2.305014902 |
| 16 | 2.385193008 | -0.335023914 | 1.5 | 2.166955797 |
| 17 | 0.955015097 | 1.755190226 | 1.625 | 1.78044105 |
| 18 | 0.32744209 | 1.035040565 | 1.75 | 1.138439619 |
| 19 | 1.579686587 | 1.951197701 | 1.875 | 0.303724928 |
| 20 | 0.414115731 | 1.070669882 | 2 | -0.514903922 |
| 21 | 0.913884208 | 1.677572239 | 2.125 | -1.068933993 |
| 22 | 0.265305572 | 1.01865866 | 2.25 | -1.109851826 |
| 23 | 1.619483831 | 1.803093365 | 2.375 | -0.422949211 |
| 24 | 1.610414434 | 1.839212722 | 2.5 | 0.926799955 |
| 25 | 2.658802449 | 2.881273233 | 2.625 | 2.50361038 |
| 26 | 2.310702177 | -0.871246759 | 2.75 | 3.629673183 |
| 27 | 2.79968645 | 3.799339763 | 2.875 | 3.616506327 |
| 28 | 0.729757139 | 1.370518104 | 3 | 1.774219949 |
We can also generate column E using AutoFill instead of evaluating INTERPXY as array formula. However, if we use the AutoFill feature,
we must lock arguments 1 and 2 so Excel does not increment them during the AutoFill by using the formula =INTERPXY(A$4:A$28, B$4:B$28, D4).
The array formula option is computationally more efficient.
The Figure below shows the interpolated y values plotted against the generated uniform x values. This plot is easily generated in Excel by highlighting columns D and E and inserting a scatter plot.
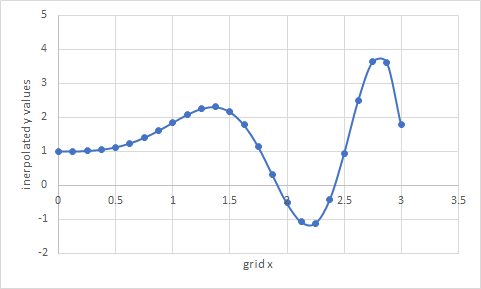
INTERPXY computes the interpolation by fitting a spline model to the data.