We use Excel Solver to find optimal values for the limits a and b which maximize an integral objective function subject to the constraint a < b.
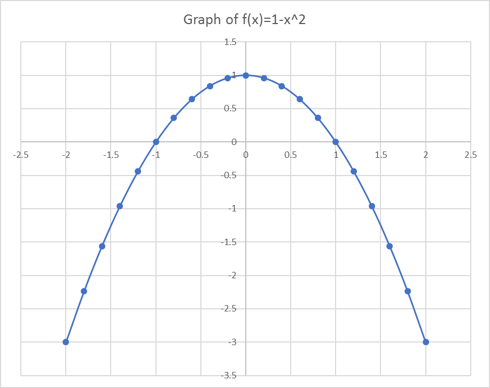
For illustration we will use the parabola f(x) = 1 - x2 for which we easily see from the graph that the maximum positive integral of f(x) is achieved when a = -1 and b = -1.

Working with named variables as shown in Table 1, we define our decision variables a and b in B1:B2 with initial values 0 and 2, our objective integral in B5, and a formula in B6 which we will supply to Excel solver to impose the constraint a < b
| A | B | |
| 1 | a | 0 |
| 2 | b | 2 |
| 3 | x | |
| 4 | f | =1-x^2 |
| 5 | objective | =QUADF(f,x,a,b) |
| 6 | constraint | =a-b |
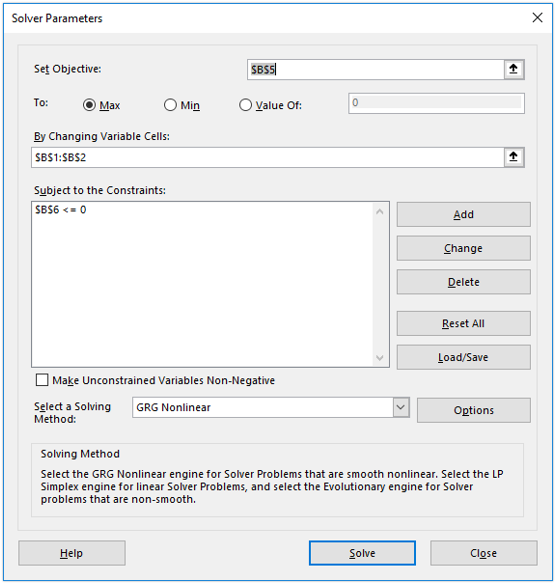
Next, we configure and run Excel Solver as shown in Figure 2. We select to maximize B5 by varying the limits B1 and B2 subject to the constraint B6 ≤ 0 .

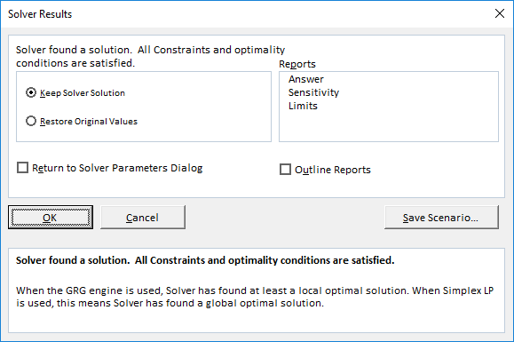
The Solver iterates until it finds the optimal solution a = -1, b = -1, then displays a Results Dialog as shown in Figure 3.
| A | B | |
| 1 | a | -1 |
| 2 | b | -1 |
| 3 | x | |
| 4 | f | =1 |
| 5 | objective | 1.3333333 |
| 6 | constraint | -2 |

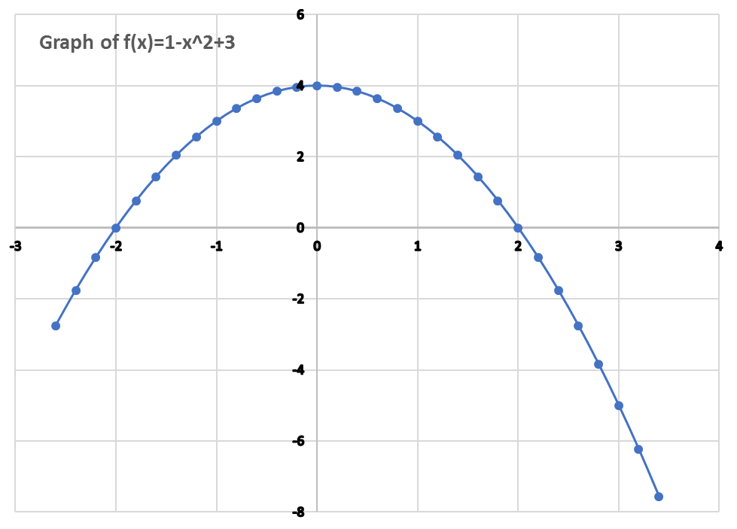
We change the objective function to
by modifying cell B4 of Table 1 to =1-x^2+b
The solution is no longer obvious visually by graphing.
We run Excel Solver again. It remembers the values form last run so we do not need to make any changes. Now it reports the new solution a = -2 and b = 3. It is interesting to note that the integral includes a negative portion between 2 and 3 yet the net value is maximized over any other values for a or b. The achieved maximum in this case is 8.3333333.
